

Fatima Husain Kanani ( Department of Chemical Pathology, Liaquat National Hospital, Karachi. )
Junaid Mehmood Alam ( Department of Chemical Pathology, Liaquat National Hospital, Karachi. )
August 2010, Volume 60, Issue 8
Original Article

Abstract
Objective: To analyze the pattern of dyslipidaemias including apolipoprotein B in type 2 diabetes.
Methods: A total of 120 diabetics were studied for their lipid profile including serum triglycerides, total cholesterol, HDL cholesterol and LDL cholesterol in fasting state, along with apolipoprotein B levels.
Results: Raised apolipoprotein B was the most frequent lipid disorder in type 2 diabetics, occurring in 56.7% of the studied patients. This was followed by high serum triglycerides levels in 55.8% and low HDL cholesterol levels in 55% of patients. Notably, 6% patients had normal triglyceride levels accompanied by raised LDL cholesterol, compared to 20% patients who had normal triglycerides with high apolipoprotien B levels. Overall, 36% of patients had normal LDL cholesterol values but elevated apolipoprotein B.
Conclusion: Apolipoprotein B is the most frequently occurring dyslipidaemia in type 2 diabetes. It identifies individuals with high risk of coronary heart disease not otherwise detected on routine lipid profile (JPMA 60:653; 2010).
Introduction
Type 2 diabetes is associated with dyslipidaemia comprising of multiple lipoprotein disorders. The most typical findings are high triglycerides and triglyceride rich lipoproteins, low levels of High Density Lipoprotein (HDL) cholesterol, normal or slightly increased Low Density Lipoprotein (LDL) cholesterol and presence of small dense LDL particles which are cholesterol depleted.1 Apolipoprotein B and apolipoprotein A-1 are the main structural proteins of atherogenic lipoproteins and HDL particles, respectively.
LDL comprises of a large buoyant LDL and a small dense LDL (sd-LDL). This small dense LDL is depleted in cholesterol and is considered to be more atherogenic than its normal counterpart because it is more easily oxidized, penetrates the arterial wall more freely and has higher affinity for proteoglycan.1 LDL cholesterol does not give the true picture because the small dense LDL is not measured, and it is this sub fraction of LDL which is particularly related to coronary artery risk and is frequently raised in diabetics.1
Coronary artery disease is the major cause of morbidity and mortality in industrialized countries. According to the Third Adult Treatment Panel (ATP III) guidelines of the US National Cholesterol Education Program (NCEP), increased LDL cholesterol is one of the primary risk factors for coronary artery disease. The guidelines recommend a full fasting lipid profile to include total cholesterol, LDL cholesterol, HDL cholesterol and triglyceride levels.2 However, recent studies have shown that apolipoprotein B provides better information regarding risk of coronary artery disease.3-5 Apo B identifies high-risk dyslipidaemic phenotypes that are not detected by standard lipid profile in type 2 diabetic patients.6 The addition of apo B to standard lipid profile could aid in timely introduction of lipid lowering therapy in these unidentified high risk patients and thus reduce mortality and morbidity due to future cardiovascular complications in them.
This analysis was undertaken to study the lipid profile and apolipoprotein B levels in type 2 diabetes mellitus patients, observe the frequency and types of dyslipidemias in type 2 diabetes mellitus patients and compare the frequency of raised LDL cholesterol with raised apolipoprotein B levels.
Patients and Method
A cross sectional study was carried out on 120 consecutive patients of type 2 diabetes mellitus in a tertiary care hospital of Karachi. Patients between the ages 35 and 70 years were included and those with history of ischaemic heart disease, on lipid lowering drugs, on insulin therapy or with concomitant disease such as liver or renal failure, hypo or hyper thyroidism, and cerebrovascular accidents were excluded from the study. Lipid profile and apolipoproteins B were analyzed in all patients. The levels of serum trigycerides, total cholesterol, LDL cholesterol and HDL cholesterol were determined on Hitachi 912, fully automated chemistry analyzer using reagents by Roche. Serum triglycerides were determined by colorimetric enzymatic assay after enzymatic hydrolysis with lipases. Serum cholesterol levels were determined by cholesterol esterase/ peroxidase method. HDL and LDL cholesterol levels were measured by direct homogenous enzymatic calorimetric assays. The cholesterol concentration of HDL-cholesterol was determined by cholesterol esterase and cholesterol oxidase coupled with polyethylene glycol (PEG) to the amino groups. LDL cholesterol was determined by first selective micellary solubilization by detergent and cholesterol esterase, followed by cholesterol oxidase/peroxidase reaction in which the intensity of the coloured dye was proportional to the cholesterol content. Apo B was determined by immunoturbidimetric method on Hitachi 912 autoanalyzer using reagents by Roche.
Both internal and external quality control protocols were strictly followed. Each run included both normal and abnormal control levels for all the analytes, and the results of the quality control sera were found to be within defined ranges. The Westguard rules were used for validation of the method. The results of lipid profile on patients\' serum samples were statistically analyzed using SPSS 14.0 for Windows.
The cut off values for normal lipid analytes were kept in accordance with NCEP ATP III guidelines:11
Triglycerides: < 150 mg/dl
Total cholesterol: < 200 mg/dl
LDL cholesterol: < 130mg/dl
HDL cholesterol: > 40 mg/dl.
The cut - off value for normal apolipoprotein B level was < 98 mg/dl.3.
Results
The laboratory and clinical features of the study population is depicted in Table-1. The mean age of the study population was 51.4 ± 10.5 years while the mean Body Mass Index (BMI) was 25.9 ± 4.0 There were 62 (52%) males 58 (48%) females. Females were more obese than males. The mean serum triglyceride values were high (190 mg/dl), with significantly higher values in females than males. Apolipoprotein B values were raised in both males (102.9 mg/dl) and females109 (Table-1).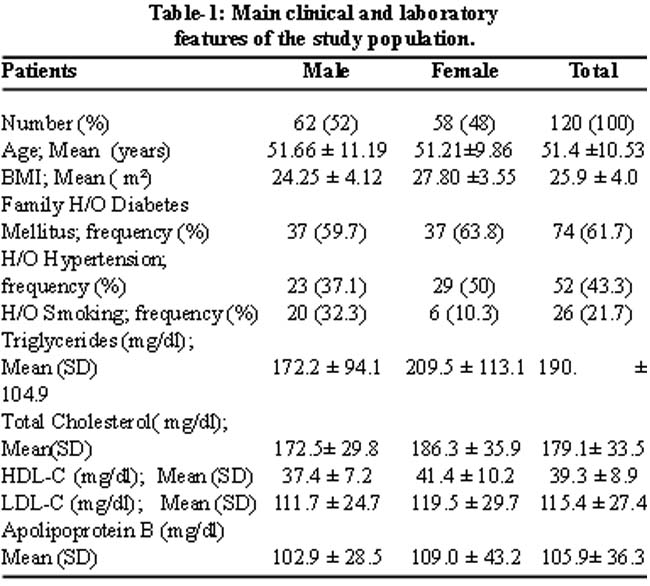
The frequency of dyslipidaemias seen in the study population is shown in Table-2,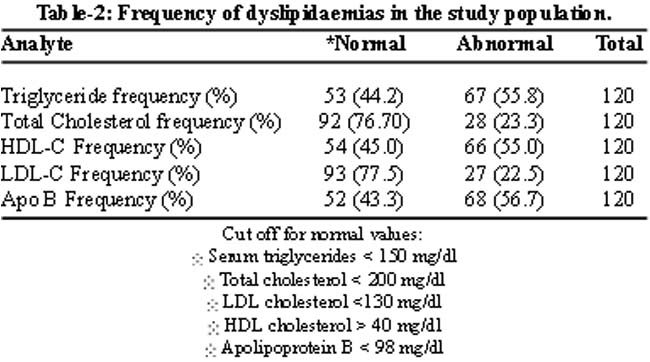
and includes high triglycerides in 67 subjects (55.8%), low HDL in 66 subjects (55%) and high apolipoprotein B levels in 68 subjects (56.7%). Only 28 cases (23.3%) of the studied population had hypercholesterolemia. LDL cholesterol results paralleled total cholesterol results and were raised in 27 (22.5%) cases.
An important point noted during analysis was that in a significant number of people with normal triglycerides and LDL cholesterol, the only indicator of a high risk dyslipidaemia was increased apolipoprotein B. Notably, 6% of patients had normal triglycerides with raised levels of LDL cholesterol but 20% had normal triglyceride levels with raised apolipoprotein B. Thus in the normotriglyceridemic group, apolipoprotein B picked up additional high risk patients. Similarly, in the hypertriglyceridemic group, 17% had high triglyceride levels with normal LDL cholesterol, compared to 37% patients who had elevated apolipoprotein B with high triglyceride levels. This is depicted diagrammatically in Figures IA and IB.
Overall, 36% of the population had normal LDLc but increased apolipoprotein B as shown in figure IC. Thus apolipoprotein B identifies additional dyslipidemic phenotypes in type 2 diabetics who would otherwise be missed on routine lipid profile.
Discussion
This study gives insight into the levels and patterns of dyslipidaemias in the local diabetic population. The results are consistent with other national and international studies which also show a preponderance of hypertriglyceridaemia and normal serum total and LDL cholesterol values in diabetics.6-8 Raised levels of apolipoprotein B has also been seen in these patients.6,7 Wagner et al have demonstrated that non HDL cholesterol and apo B show a similar raised pattern in hypertriglyceridaemia diabetics, but apo B identifies additional high risk patients who have normal triglyceride levels.9 High apoB levels were also found in almost half of the normocholesterolaemic type 2 diabetic patients.6 Sniderman AD has show that only 23% of diabetics have abnormal LDLc, while 40% have abnormal apo B.7 Diabetes per se increased apo B concentration, and apo B is raised more frequently in coronary artery disease patients than LDL cholesterol.3
Apo A1 is the major structural protein of HDL, while Apo B is contained in all the atherogenic lipoproteins, including VLDL, IDL and LDL. In general, apo B-containing lipoproteins carry lipid from liver and gut to the sites of utilization, whereas apo AI-containing particles mediate reverse cholesterol transport, returning excess cholesterol from peripheral tissues to the liver. Diabetic dyslipidaemia is characterised by retention of atherogenic particles, which are depleted of cholesterol.4 Therefore, calculating or measuring LDL or VLDL cholesterol may not reflect the actual number of these atherogenic particles, while the plasma concentration of apo B indicates their cumulative number. Apolipoprotein measurements present some methodological advantages when compared with LDLc quantification. In many labs LDLc is still calculated by the Friedewald equation which only provides an estimate of the LDLc values, and depends on total cholesterol, triglyceride and HDLc levels. In this manner, the estimate may include the possible analytical errors of these three parameters, thus increasing the likelihood of errors and of potential impact in clinical decisions. This equation also presents several limitations and the LDLc estimate cannot be extended to samples presenting triglyceride levels higher than 400 mg/dl, samples containing chylomicrons and to patients with dysbetalipoproteinaemia. In addition, some studies have shown that the homogeneous method for measuring LDLc and the estimate of these values by the Friedewald equation do not show similar results.10,11
On the other hand, apolipoproteins may be measured directly in plasma through accurate and precise internationally standardized methods, by using a common reference material for apo A-I and apo B, which is not routinely available for measurements of HDLc and LDLc.12 Besides, it can be measured without the significant interference of high triglyceride levels. Plasma apolipoprotein levels are only slightly influenced by biological variables, and fasting samples are not required for their measurement, whereas plasma lipid levels fluctuate in response to various metabolic control stimuli.
It is therefore concluded that due to the methodological and clinical benefits apolipoprotein B should be included in the dyslipidaemic work up of diabetics to correctly assess the potential atherogenic risk.
References
1.Jiang R, Schulze MB, Li T, Rifai N, Stampfer MJ, Rimm EB, et al. Non-HDL cholesterol and apolipoprotein B predict cardiovascular disease events among men with type 2 diabetes. Diabetes Care 2004; 27: 1991-7.
2.Expert Panel on Detection, Evaluation, and Treatment of High Blood Cholesterol in Adults: Executive summary of the third report of the National Cholesterol Education Program (NCEP) Expert Panel on Detection, Evaluation and Treatment of High Blood Cholesterol in Adults (Adult Treatment Panel III) JAMA 2001; 285: 2486-97.
3.Snehalatha C, Ramachandran A, Sivasankari S, Satyavani K, Viswanathan V, Misra J, et al. Is increased apolipoprotien B. A major factor enhancing the risk of coronary artery disease in type 2 diabetes? J Assoc Physicians India 2002; 50: 1036-8.
4.Walldius G, Jungner I. The apoB/apo A-1 ratio: a strong new risk factor for cardivascular disease and a target for lipid- lowering therapy- a review of the evidence. J Intern Med 2006; 259: 493-519.
5.Kim BJ, Hwang ST, Sung KC, Kim BS, Kang JH, Lee HM, et al. Comparision of relationships between serum apolipoprotein B and serum lipid distributions. Clin Chem 2005; 51: 2257-63.
6.Wagner AM, Perez A, Calvo F, Bonet R, Castellvi A, Ordonez J. Apolipoprotein (B) identifies dyslipidemic phenotypes associated with cardiovascular risk in normocholesterolemic type 2 diabetic patients. Diabetes Care 1999; 22: 812-7.
7.Sniderman AD, Lamarche B, Tilley J, Seccombe D, Frohlich J. Hypertriglyceridemic hyperapoB in type 2 diabetes. Diabetes Care 2002; 25: 579 82.
8.Firdous S, Khan MZ. Comparision of patterns of lipid profiles in type 2 diabetics and non- diabetics. Ann King Edward Med Coll 2007; 13: 84-7.
9.Wagner AM, Perez A, Zapico E, Ordonez-Llanos J. Non-HDL cholesterol and apolipoprotein B in the dyslipidemic classification of type 2 diabetic patients. Diabetes Care 2003; 26: 2048-51.
10.Mora S, Rifai N, Buring JE, Ridker PM. Comparison of LDL Cholesterol concentrations by Friedewald calculation and direct measurement in relation to cardiovascular events in 27 331 Women. Clin Chem 2009; 55: 888-94.
11.Nauck M, Warnick GR, Rifai N. Methods for measurement of LDL-Cholesterol: a critical assessment of direct measurement by homogeneous assays versus calculation. Clin Chem 2002; 48: 236-54.
12.Marcovina S, Packard CJ. Measurement and meaning of apolipoprotein A1 and apolipoprotein B plasma levels. J Intern Med 2006; 259: 437-46.
Journal of the Pakistan Medical Association has agreed to receive and publish manuscripts in accordance with the principles of the following committees:


