

Khalid S. Khan ( Department of Obstetrics and Gynaecology, Aga Khan University Medical Centre, Karachi. )
Firasat A. Hashmi ( Department of Obstetrics and Gynaecology, Aga Khan University Medical Centre, Karachi. )
Javaid H. Rizvi ( Department of Obstetrics and Gynaecology, Aga Khan University Medical Centre, Karachi. )
July 1995, Volume 45, Issue 7
Original Article

Abstract
To determine, in non-diabetic women, the relationship of abnormal glucose screening test, with the incidence of pre-eclampsia, macrosomia and caesarian delivery, from 1988-92, 5646 consecutive women attending antenatal clinic were screened with a glucose challenge test (GCT) on their first visit (usually at 16-20 weeks); those with risk factors i.e., history of unexplained perinatal loss, macrosomia or family member with diabetes and an initial abnormal screening test were rescreened at 28-32 weeks, In 482 cases the GCT was abnormal (plasma glucose value was >140 mg% 2 hours after 75g glucose challenge). Of these, 292 had one or more abnormal critical values at a 75g -3 hour oral glucose tolerance test (GTT) and they were treated to maintain euglycaemia. The rest (n=190) had no evidence of glucose intolerance with no abnormal values at the GTT. The subjects were divided into 3 groups based on GCT values; A, randomly selected subjects with a normal GCT (n=1000); B, those with abnormal GCT but normal GTT (n=190); and C, those with abnormal GTT (n=292). The variables studied were age, gravidity, parity, gestational age at delivery, pre-eclampsia, birth-weight and mode of delivery. The incidence of pre-eclampsia and caesarian birth varied, being the lowest in Group A (3.9% and 11.9% respectively) and then rising through group B (6.3% and 16.3% respectively) to the highest in Group C (12.6% and 26.0% respectively; test of linear trend, p<0.05). For macrosomia, the incidence increased from Group A to B but there was a drop in Group C. The incidence of macrosomia was significantly higher for Group B as compared to A or C (9.5% and 3.3%, p
Introduction
Pre-eclampsia, fetal macrosornia and high caesarian rates are well known to be associated with carbohydrate intolerance in pregnancy. These and other complications lead to a high morbidity and mortality in diabetes mellitus during pregnancy1. The present criteria requiring two abnormal glucose tolerance test (GTT) values for diagnosis of gestational diabetes mellitus (GDM), are not strict enough to screen for these complication2-4. In addition, there are several different GUs and those with high thresholds do not identify a high numberof gestational diabetics5, leaving these pregnancies at risk. The relation of pregnancy complications to sub-diabetic elevations of maternal plasma glucose levels has been demonstrated using one abnonnal GTT value as a risk indicator3,4. The association of known complications of gestational diabetes with minor degrees of hyperglycemia, which may not be detectable by a Gil’. needs further evaluation. At the Aga Khan University Medical Centre, Karachi, screening with a 75g -2 hour glucose challenge test (GCT) is performed routinely for all women attending antenatal clinics6. We thus had the opportunity to examine the relationship of plasma glucose value in the GCT, in women with no evidence of glucose intolerance, with incidence of some known complications of diabetes mellitus in pregnancy.
Subjects and Methods
This study was carried out at the Aga Khan University Hospital, Karachi, where general and tertiary health care facilities are provided to a sell-referred population. In the obstetrics division, since January, 1988, all pregnant women not known to be diabetic were screened for gestational diabetes as described in detail elsewhere6. The screening test consisted of a 75 g OCT in which a single venous blood sample, obtained 2 hours after oral glucose administration, was used for plasma glucose estimation (hexokinase method with an autoanalyser).The glucose load was administered in 300 mls of fluid given orally over a 5 minute period. Fasting was not required. This test was administered first at the initial booking visit (usually at 16-20 weeks gestation). If the plasma glucose value was 140 mg% or above, the test was considered abnonnal and a formal 75g -3 hour oral Gil’ was carried out. The GCT was repeated at 28-32 weeks on selected women. The criteria for repetition included an initial abnormal GCT followed by normal GTT and presence of features of potential diabetes i.e., close family history of diabetes, previous macrosomic baby and history of unexplained stillbirth/neonatal death. A repeat GTF was performed if the plasma glucose value at the repeat OCT was 140 mg% or more. For administration of the Gil’, all subjects consumed an unrestricted caibohydrate dietforatleast 3 days priorto the test and came fasting for 10-12 hours on the morning of the GTT. The criteria used for diaqnosing glucose intolerance were modified from O’Sullivan and reported in a recent literature review5. They were the same as those used in our previous report6. Fasting, 1 hour, 2 hour and 3 hour values of plasma glucose were used where values of >105 mg%, >186 mg%,>140 mg% and >122 mg% respectively are considered abnormal. Two or more abnormal values were taken as evidence of 0DM anda single abnormal value was considered impaired glucose tolerance test (JOT). All patients with 0DM and lOT were managed according to the same protocol. Plasma glucose series, with fasting, pre-lunch and post-dinner values, were performed after initiation of dietary restriction to a high protein 2000 k cal diet. The plasma glucose series was repeated every 2-4 weeks depending on the plasma glucose values, lithe fasting value was >110 mg% or if the pre-lunch or post-dinner value was >140 mg%, insulin was added to dietary restriction and plasma glucose series was monitored every 2 weeks. The time and mode of delivery was decided according to glycemic control and presence of complications by the consultant obstetrician. Over a four years period between June, 1988 and June, 1992 a total of 5646 women were screened and managed according to this protocol. The prevalence of abnonnal OCT in this group was 8.6% (n=482; 278 had an abnormal GCT at initial screen and 204 atrescreen). The data fora control group in this study were obtained from a database of 1000 cases chosen by simple random selection out of 5 164women with a normal OCT (group A). The 482 women with an abnormal OCT underwent a GTT. The group studied consisted of 190 women with an abnormal OCT but a normal GTT (group B). Anabnormal OTTwasfound in 292 womcn(eitherODM: 177 cases orIGTT: 115 cases) including 55 with an abnormal Oil’ after rescreening at 28 weeks. These 292 women were managed by dietary restriction or diet/insulin therapy (group C). Thus in the three groups A-C, group A represented those with normal glucose tolerance; group B those with minor glucose intolerance as evident by abnormal GCT but required no therapy as OTT was normal and group C, those with 0DM/JOT and receiving therapy for it. The variables studied were age, gravidity, panty, gestational age at delivery, birth-weight, pre-eclampsia and caesarianbirth. Gestational age was determinedby the date of the last menstrual period if the preceding cycles were regular without use of oral contraceptives and corresponded to physical examination and ultrasonography at <20 weeks’-gestation. In case of uncertain dates gestational age was determined by ultrasonography on two occasions that resulted in consistent estimates at <26 weeks’ gestation. Pre-eclampsia was defined as combination of hypertension (B.P.> 140/90 mmHg) and proteinuria (>300 mg%) developing after 20 weeks’ gestation. Macrosomia was defined as a birth-weight of 4 kg or more. The data were analyzed with the Statistical Package for Social Science (SPSS/PC+). Analysis of variance (ANOVA) was used for normally distributed variables and Kruskal-Wallis test was used for those not normally distributed (gravidity and panty). The test of linear trend in proportions was used to determine trends. Chi-square test and Student’s ‘t’ test were used to assess difference between proportions and means respectively. A ‘p’ value of <0.05 was taken as significant.
Results
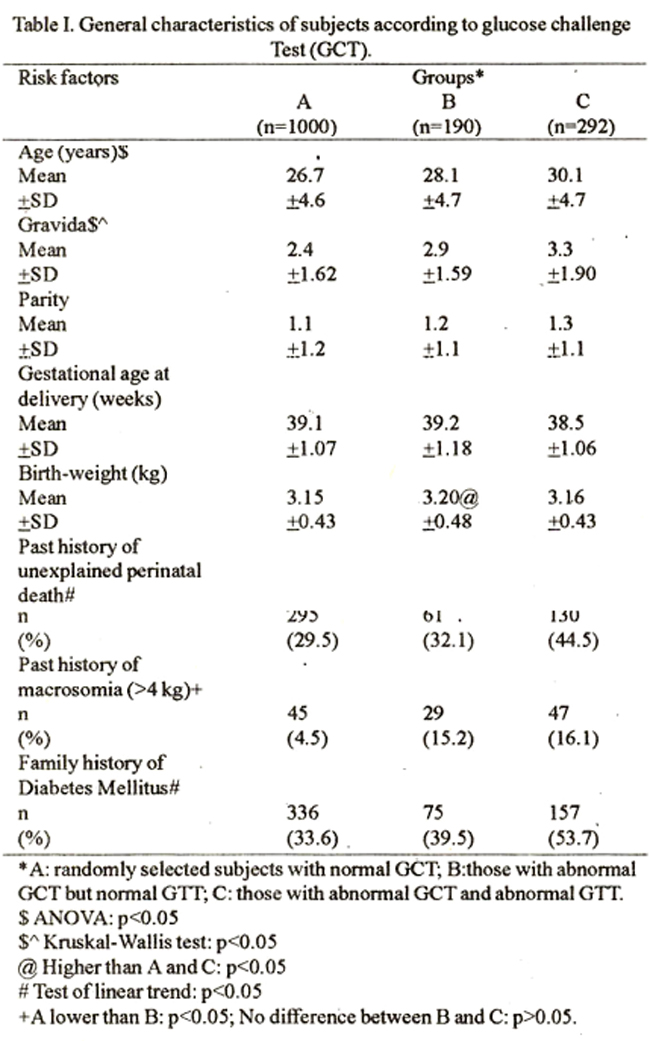
Table I shows the mean values of age, gravidity, parity, gestational age at delivery and birth-weight in the different groups of OCT results. The prevalence of risk factors is also shown. Subjects with higher OCT values were older (ANOVA); p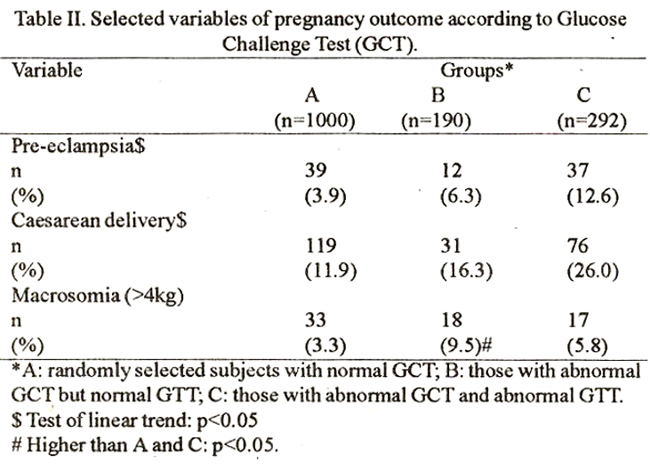
Table II shows the frequency/incidence of pre-eclampsia, macrosomia and caesarian birth in the different groups of GCT values. As the glucose tolerance became worse, the incidence of pre-eclampsia and caesarian birth varied, being lowest in group A and highest in group C (Test of linear trend:p). However, for macrosomia, the incidence increased as the GCT value increased from Group A to B but there was a drop in Group C. The incidence of macrosomia was higher for group B as compared to A or C (p<0.05).
Discussion
The aim of screening is to use a simple and affordable test with acceptable sensitivity and specificity to identify risk population early enough to perform diagnostic test and institute therapy in order to improve outcome. Numerous publications on screening strategies for GDM have been critically reviewed8,9 and the estimation of blood glucose hour after 50 g oral glucose load was found to be the most commonly used test for screening8. There was lack of consensus on the screening threshold of the blood glucose value and the worth of such screening has been openly questioned9. In these reviews the use ofa75 g glucose load for glucose screening test has notbeenevaluated. The 75g glucose load for screening was recommended by the WHO10. There is sufficient evidence that a 2 hour time interval improves specificity of the GCT11. Increasing the load of glucose from 50g to 75g is also known to improve the efficiency of the GCT12. Successful experience with such screening has been documented invarious reports6,13. The sensitivity of this testis 83% and specificity 90.7%13 which is similar, if not superior, to the 79% sensitivity and 87% specificity of the 50 g glucose screening test8. The question of timing of the GCT has been’ asked in several reports and more recent literature is in support of earlier screening14. We initially screened at 16-20 weeks gestation and then rescreened at 28 weeks which has been (in~u shown to. be the optimum time for detecting gestational diabetes. Pre-eclampsia, a disorder of unknown etiology, is associated with high rate of mothidity and mortality. This disorder is known to occur more frequently in 0DM as well as in IGT1,3. This study shows that the incidence of pre-eclampsia increases dramatically with worsening degree of glucose intolerance (Table II) Similartrend was seenby Tallarigoctal using 2 hour plasma glucose value in a 100g GTT2. Early pregnancy proteinuria is reported to be associated with pre-eclampsia in GDM15. It has been speculated that poor glycemic control in the second trimester might interfere with the second wave of trophoblastic invasion16 or some direct effect ofglucose on the vascular epithelium could predispose to hypertensive disorder in diabetic women15. Frequent use of elective delivery and other complications like macmsomia lead to high caesarian rates in women with diabetes1,17. Our data (Table II) suggests that for caesanan deliveiy a linear trend exists with worsening caibohydrate intolerance similar to that shown by Tallarigo et al2. Hence, non-diabetic women with abnormal glucose screening test (group B) are at higher risk than those with nonnal screening (group A). This may have been so because one is more easily inclined to intervene with a caesarian in women withprevious perinatal loss and such histoiy was more frequent in group B than A (Table I). In addition, pre-eclampsiaand macrosomia were also more frequent in group B (Table II) which might have resulted ma high caesarian rate. Foetal macrosomia is associated with increased risks of maternal and neonatal morbidity. In this study macmsomia was more frequent in group B as compared to A or C (p<0.01). Gestational age at deliveiy is a major determinant of birth-weight4,17. Mean gestational age at delivery were similar in groups A and B, but lower in group C (Table I). Early elective delivery may have been responsible for restriction of foetal size in group C. In addition, the incidence of pre-eclampsia was highest in this group and hypertension has been shown to have a negative effect on birth-weight in treated diabetic pregnant women18. In non-diabetic women like those in groups A and B, the studies on the association between macrosomia and minor degrees of glucose intolerance, using a 50 gglucose screening test have been inconclusive19. With a 75 g glucose load, we found that an increasing plasma glucose value at OCT from <65 mg% to >140 mgk% was associated with an increasing incidence of macrosomia from 1.2% to 9.5% (Test of linear trend: p’<0.01). This trend was reproducible after controlling for panty and gdstational age. As proposed hypotheses have related foetal growth to foetal insulin21 and maternal glucose levels22, we hypothesize that women with minor degrees of glucose intolerance had macrosomic babies due to mild maternal hyperglycemia significant enough to cause foetal hypennsulinemia. The high incidence of poor pregnancy outcome in women with abnormal glucose screening but normal GTT (Table II) could be explained by the lack of reproducibility in the GTT5. This may have led a number of women in this study to have one or two abnormal values if the test was repeated subsequently. It is more likely, we believe, that in the present series, womenwithminordegrees of carbohydrate intolerance (group B) had complications due to mild though significant hyperglycemia. The association of high rates of pre-eclampsia, macrosomia andcaesananbirth with sucha limited degree of glucose intolerance warrants that anticipatory counseling regarding these risks be offered to women with abnormal glucose screening tests.
Acknowledgements
The authors are grateful to Mr. J. I. Qureshi for preparation of the manuscript; to Pn)fessor S.C. Robinson for its critical review and to all the consultants and staff for their untiring efforts during the period of this study.
References
1. Hunter, D. J. S. Diabetes in pregnancy. In: Chalmers, I., Enkin, M., Keirse, M. J. N. C. (eds): Effective care in pregnancy and children, Vol. 1, Oxford, Oxford University Press, 1989, pp. 578-591.
2. Tallarigo, L., Giampietro, 0., Penno, G. et al. Relation ofglucose tolerance to complications of pregnancy in non-diabetic women. N. Engl. J. Med., 1986;3 15:989-92.
3. Lindsay,M. K., Graves, W., Klein, L. The relationship of one abnormal glucose tolerance test value and pregnancy complications. Obstet. Gynaecol., 1989’,73: 103-106.
4. Kaufmann, R. C., McBride, P., Amankwah, K. S. et al. The effect of minor degrees ofglucose intolerance onthe incidence ofNeonatal macrosomia. Obstet. Gynaecol., 1992;80:97-101.
5. Reece, E. A., Assimakopoalos, E., Hagay, Z. et al. Assessment of carbohydrate tolerance in pregnancy. Obstet. Gynaecol. Surv., 1 990;46: 1-12.
6. Khan, K. S., Rizvi, J. H., Qureshi, R. N. et al. Gestational diabetes’ in a developing country. Experience of screening at the Aga Khan University Medical Centre, Karachi. J. Pak Med. Assoc., 1991;41 :31-33.
7. O’Sullivan, J. B. Establishing criteria for gestational diabetes. Diabetes Care, 1980;3 :437-39.
8. Cousins, L.,Baxi, L., Chez, R. et al. Screening recommendations forgestational diabetes mellitus. Am. 3. Obstet. Gynaecol., 1991; 165:493-96.
9. Canadian Task Force on the periodic health examination. Screening for gestational diabetes mellitus. Can. Med. Assoc. 3., 1 992;1 47:435-43.
10. WHO study group report Gestational diabetes; Technical report series. Geneva, WHO, 1985, pp. 727;9-20.
11. Weiner, C. P., Froser, M. M., Bums, 3. M. et al. Cost efficiency of routine screening for diabetes in pregnancy: One hourversus 2 hour specimen. Diabetes Care, 1 986;9:255-59.
12, Merkatz, 1 R., Duchon, M. A., Yamashita, T. S.et al. A pilot community based screening program for gestational diabetes. Diabetes Care, 1 980;3:543-47.
13. Pather, R. 75 Gram glucose load for diabetic screening in pregnancy - An evaluation. S. Aft. Med. 3., 1 989;76: 53-54.
14. Super, D. M., Edelbarg, S. C., Philpson, E. H. et al. Diagnosis of gestational diabetes in early pregnancy. Diabetes Care, 1991; 14:288-294.
15. Combs, C. A., Rosenn, B., Kitzmiller, J.L. etal. Early pregnancy proteinuria in diabetes related to pre-eclampsia. Obstet. Gynaecol., 1 993;82:802-807.
16. Siddiqui, T., Rosenn, B., Mimouni, F. et al. Hypertension during pregnancy in insulin dependent diabetic women. Obstet. Gynaecol., 199 1;77:514-1 8.
17. American College of Obstetricians and Gynaecologists, Fetal macrosomia. Technical Bulletin No. 159. Washington DC, ACOG, 1991.
18. Cundy, T., Gamble, 0., Manuel, A. et al. Determinants of birth weight in women with established and gestational diabetes. Aust. Ni. 3. Obstet. Gynaecol., 1993;33:249-54.
19. Witter, F. R. and Niebly, J. R. Abnormal glucose screening in pregnancy in patients with normal oral glucose tolerance tests as a screening test for fetal macrosomia. Int. J. Obstet. Gynaecol., 1988;27:181-84.
20. Khan, K. S., Syed, A. H.. Hashmi, F. A. et al. Relationship for fetal macrosomia to a 75 gram glucose challenge test in non- diabetic women. Aust. Ni. J. Obstet. Gynaecol., l994;34:24-27.
21. Petersen,j. Weight and length at birth of infants of diabetic mothers. Acta Endocrinol., 1954;16:330-42.
22. Frenikel, N., Metzzger, B. E., Phelps, R. L. et al. Gestational diabetes mellitus. Diabetes, 1987,34:1-7.
Journal of the Pakistan Medical Association has agreed to receive and publish manuscripts in accordance with the principles of the following committees:


