
Assad Hafeez ( Departments of Pacdiatrics, CMH, Lahore. )
Qudrat Ullah Malik ( Departments of Pacdiatrics, CHM, Muree. )
December 1996, Volume 46, Issue 12
Original Article
Abstract
Blood lead levels were determined in preschool children residing in Urban areas of Rawalpindi city. Of 92 (50 males and 42 females) children aged one to 5 years were included in the study. Blood lead levels ranged from 7 ug/dl to 34 ug/dl (mean 18.8 ug/dI). The mean lead levels were slightly higher in males (20.3 ug/dI) than in females (17.2 ug/dl) and over 90% children had lead levels above the acceptable limit of 10 ug/dI. Use of leaded petrol, contaminated surma, leaded paints and pica in children are common in our country and may lead to increased lead levels and appropriate measures should be taken to control this trend (JPMA 46:272, 1996).
Introduction
Man and lead have lived together for centuries and the use of lead dates back to atleasi. 5000 years. Various lead compounds have been used by different industries, but lead alkyls are the major source of pollution today. Gasoline combustion has been the single major contributor to environmental lead pollution since early 20th century. Other sources are lead plumbing. lead containing paints and surma. Lead is mainly absorbed via GI tract in h umans. The absorption of lead is only 5-1 0% in adults hut in children, 40-45% of ingested lead is absorbed making children, vulnerable to lead intoxication from water and food intake. Almost 70% of inhaled lead acetyl is absorbed and comes in circulation. After extensive research by various workers1-3 the minimum upper limit of blood lead level has been brought down from 25 ug/dI to 10 ug/dl4. The Port Pine Cohort Study and other cross sectional and longitudinal studies revealed that low level exposure to lead during early childhood is inversely associated with neuropsychological development through the first 7 years of life5. The intelligence ofexposed children drops with rising lead levels. 1)ecrease in IQ poor ability to think and reason. hyperactivity, decreased attention span, fearfulness and learning disorders are few of the effects of lead exposure on developing brain.
To curtail lead pollution in the environment, the developed countries have successfully adopted appropriate measures to lower blood lead levels to acceptable limits6. In our country there is no awareness regarding this important issue in general public and scientific circles and no study has been conducted on lead levels in preschool children. Reports from Karachi, Peshawar and Islamabad have included only school going children7-9. The present work was undertaken to determine blood lead levels in pre-school children of Rawalpindi city.
Materials and Methods
A total of 92 children. 50 males and 42 females were included in the study. Ages of children ranged from Ito 5 years and all were residing in urban areas of Rawalpindi. Their nutritional status was within normal range and none were suffering from major disease or taking any medication. Two milliliter of whole blood was collected from each child using a disposable syringe and butterfly needle and was stored in glass tube containing 0.1 ml heparin. To decrease lead contamination, all glassware was kept in 20% nitric acid for 24 hours and later washed with double- deionized distilled water. All glassware was vacuum dried and used only once for sample preparation and analytical procedure. Only double-deionized water was used. Anticoagulant (heparin) was tested and contamination with lead was found to be negligible. Blood lead levels were estimated on Hitachi 180-80 Polarized Zeeman Atomic Absorption Spectrophotorneter with Zeeman correction mode using acetylene flame as atomizer10. The spectrophotometer was set at following settings: lamp current 7.5 mA. fuel flow 0.3 kg/cm square, air flow 1. .4 kg/cm square, wavelength 28.3 nrn, slit width 1. .3 nm. The samples were prepared in batches of 1 0 and storage if required, was done in refrigerator at 4 degree centigrade for not more than 24 hours.
Results
The blood lead levels in 90 children ranged from 7.2 ug/di to 34.8 ug/dI with a mean value of 18.86 ug/dl. The mean blood lead levels in males was 20.3 ug/dl and in females was 17,2 ug/dI. The children were grouped in various ranges, according to their blood lead levels, as described by CDC Atlanta4 (Table).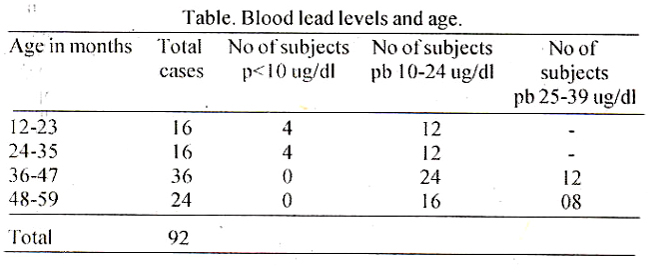
The distribution revealed that almost 70% children had levels ranging between 10-24 ug/dI and only 9% children had levels less than 10 ug/dI. None ofthe subjects had lead levels over 40 ug/dl. Lead levels according to sex distribution are shown in Figure.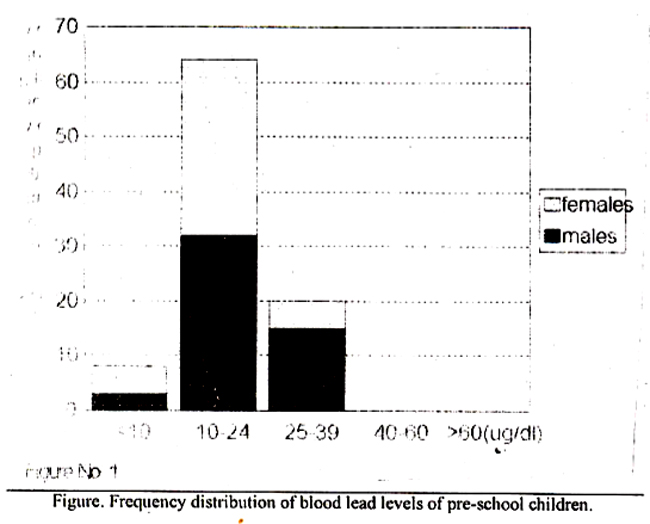
Discussion
Lead has no known physiological function in body. It has been regarded as a highly toxic, non-essential element with no beneficial biochemical role. Lead encephalopathy was first noted in 191011. Byers and Lord12 detected late effects of lead poisoning in children and suspected lead as a cause of school failure and behavioural disorders. It is the first few years of life in which lead exposure can be very damaging to the developing brain.
In present study, over 90% of preschool children had blood lead levels above the acceptable limit. Only 9% children were within the safe range of 1 0 ug/dl. The most vulnerable age group was 3-4 years. Most children with raised blood lead levels fell in this age group. This is the age when children go out of their homes to play in streets and grounds where they get exposed to automobile exhaust fumes and contaminated soil. Pica is common in these children and use of surma is widespread. All these factors may lead to rise in blood lead levels.
Blood lead levels in USA range between 6.3 to 7.8 ug/dl in preschool children13. These levels were brought down from a mean of 18 ug/di to 9 ug/di, over a period of 4 years, mainly by introduction of lead free petrol6. Even today an average American absorbs about 21 ug of lead from food14. No such statistics are available from our country but the quantity absorbed might be much more in children because of consumption of road side food which is heavily polluted by vehicular fumes. In a local study increased lead levels were documented in milk transported by public transport15. Some reports of high lead levels in school going children have been published in local literature. In Peshawar, the mean blood levels were 21 .2 ug/dI for males and 16.8 ug/dl for females8, the mean levels for Islamabad were 22.8 ug/dl9. whereas in Karachi, much higher lead levels were recorded ranging between 21.3 to 52.2 ug/dI (mean 38.2 ug/dI) from a school in Karachi Defence Society; none of the children had levels below 20 ug/dl7. All previous reports and the present data suggests that lead levels in Pakistani chjldren are well beyond the acceptable limits and is probably hampering the intellectu al capabilities of the coming generation .Childhood exposure to lead is preventable. The importance of safeguarding the intellectual and educational capabilities of our children against preventable disease cannot be over-looked, so all possible measures should be taken to save our future. To achieve this, masses should be sensitized by health education. Frequent assessment and screening of lead levels should be carried out in target age groups. Use of leaded petrol should be discouraged and other sources of lead as leaded paints, lead plumbing and contaminated surma should be eliminated. The high cost of removing sources of lead however, may remain a major hindrance to this effort.
References
1. Needleman, H.L.. Cunnoe, C.. Leviton, A. et al. Deficits in psychologic and classroom performance of children with elevated dentine lead levels. N. Engl. J. Med., 1979;300:689-695.
2. Bellinger, D.. Leviton, A.. Water-naux, C. et al. Longitudinal analyses of prenatal and postnatal lead exposure and early conginitive development. N. EngI. J. Med., 1987;316:1037-1041.
3. Kim, ND., Kathleen. M.K., Robert, LB. et al. l.ow level fetal lead exposure effect on ncurobehavioral development in early infancy. Pediatrics, 1987;80:721-730.
4. Preventing lead poisoning in children. A statement by the Cenler for disease control. Atlanta, GA: CDC. 1991.
5. Baghurst, PA., Mc-Michael, A.J., Wigg, N.R. et al. Environmental exposure to lead and children’s intelligence at the age of seven years. N. Engl. J. Med., 1992;327:1279-84.
6. Annest, J.L.. Pible, J.L., Makug, D. et at. Chronological trend in blood lead levels between 1976 and 1980. N. EngI. J. Med.. 1983;308: 1373-7.
7. Manser. W.W.T.. Lalani. R., Ilaider, S. et al. Trace elements studies on Karachi populations Part V: Blood lead levels in normal healthy adults and Grammar school children. J.Pak. Med. Assoc.. 1990:40(7): 150-4.
8. Zahoorullah Haq, T., Akhtar. T. and Akhtar, M. Blood lead levels in school children ofPeshawar city. Pak. J. Med. Rca., 1994:33:117-20.
9. Ahmed, S. Blood lead levels in children of Islamabad. Pak. J. Med. Res., 1992;31:91-93.
10. Wang, S.T.,Pizzaloto, S. and Peter. F. Microsampling technique and determination of blood lead by Zeeman atomic absorption spectrophotornetry. Sri. Total Environ.. 1988:71:37-43.
11. Prendergast, W. The classification of symptoms of I cad poi soiling. Br. Med. J.. 1910;1:1164.
12. Needleman. 1-EL. The behavioral consequences of low level exposure to lead. In: Saikar. B. Ed. Biological aspects ofmetal and metal related diseases. New York. Raven press, 1983, pp. 219-24.
13. Bellinger, D.C., Stiles, KM. and Needleman, H.L. Low level lead exposure, intelligence and academic achievement: A long term follow up study.Pediatrics, 1992;90:855-861.
14. Settle, D.M. and Petterson, CC. Lead ill albacore; guide to lead pollution in Americas. Science. 1980;207: 1167.
15. Ashraf, MW. Screening of locally available milk for lead contamination. Dissertation. Department of Chemistry. Quaid-e- Azam University Islamabad, 1990. p. 68.
Journal of the Pakistan Medical Association has agreed to receive and publish manuscripts in accordance with the principles of the following committees: